
Benchmark Solana RPC endpoints

TL;DR
Most RPC benchmarks on Solana only measure how quickly a node reports new processed slots. That shows you surface latency, but it won’t tell you which endpoint gets shreds faster, assembles blocks quicker, runs transactions more efficiently, or stays consistent over time.
Our open-source tool Thorofare fixes that. It runs two endpoints in parallel and measures every stage of a slot end-to-end, including download time, replay time, account update propagation, and overall consistency, enabling an in-depth, side-by-side comparison.
The problem with RPC speed tests
We've seen RPC benchmarking for Solana measured in slot updates, using the Processed commitment; timing from one Processed slot to the next.
This methodology captures only a small portion of what affects endpoint performance — missing shred propagation delays, the time to download and assemble blocks, transaction execution performance, and network topology effects. (Yes, that’s a human em dash. lol.)
But look no further — we have developed a comprehensive benchmarking methodology and a suite of open-source tools that track six slot lifecycle stages and correlate them with account update propagation: the Thorofare CLI Tool and the UI Visualizer.
Open-source tools: CLI and visualization UI
Before diving into methodology, here's what we've built:
- Thorofare CLI: A tool for running concurrent endpoint comparisons. (Github)
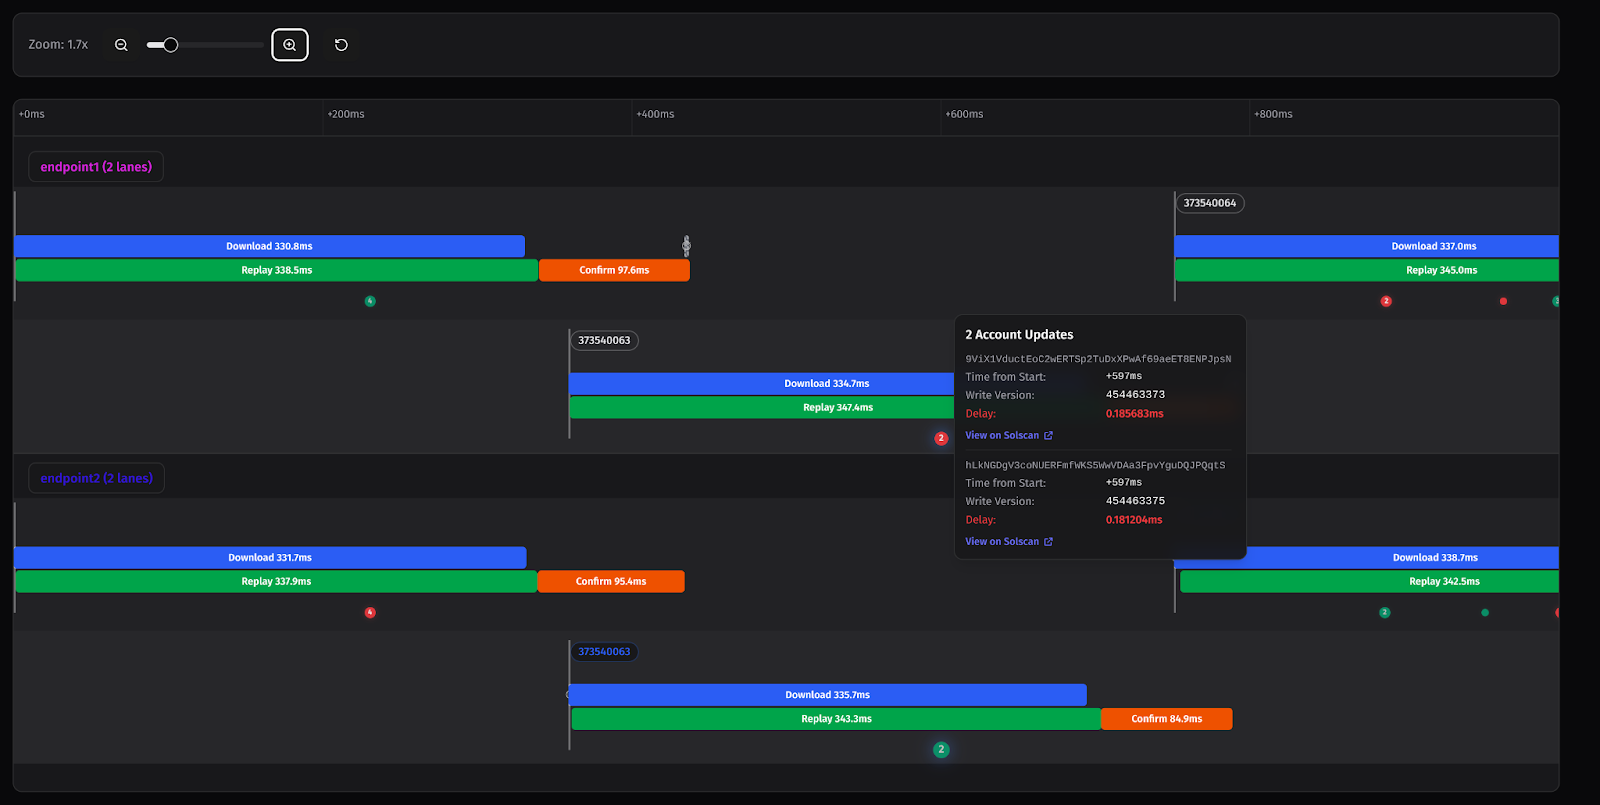
- Thorofare Interactive Visualization UI: A tool for analyzing and visualizing benchmark results. (Github, Deploy)
First, the CLI tool collects comprehensive metrics from two user-supplied endpoints simultaneously. After this, the UI can be used to visualize all six slot stages and scatter plots, revealing a more in-depth view of account update patterns.
Why a full performance breakdown matters
- Traders: A 20ms delay means missed opportunities. In competitive markets, you're watching money go to faster competitors.
- Developers: Inconsistent latency creates an unpredictable user experience. Your app might work perfectly one moment and fail the next time when you need it most.
- Validators: Understanding your Validator performance helps identify whether your CPU is keeping up with transaction execution, whether your network connectivity is sufficient, or whether you're falling behind on block processing and cascading delays to subsequent slots.
How Solana slot propagation works
Shred assembly and parallel execution
Shreds are UDP packets containing fragments of block data¹. Multiple shreds must be received and assembled to form entries⁴, with each entry containing a vector of VersionedTransaction⁵.
Critically, execution begins as soon as the first complete entry is assembled from shreds - we don't wait for all shreds to arrive. This means the replay happens in parallel with the receipt of remaining shreds. FirstShredReceived⁶ indicates the first fragment arrived, but execution may start shortly after as entries become complete. The Completed status confirms all shreds have arrived, but execution is already well underway.
The six slot stages⁷
It’s actually seven (7) because of the Dead slot status, but in this case we will not consider it.
FirstShredReceived: First shred fragment arrives. The earliest signal of a new slot beginning.
CreatedBank: Execution environment initialized. It can only happen after the parent slot is frozen.
Completed: All shreds received and assembled into a complete block with all entries.
Processed/Frozen: All transactions executed, state changes committed.
Confirmed: 66% stake weight has voted for this slot.
Finalized/Rooted: Irreversible after ~12-13 seconds with 31+ blocks built on top.
Parent slot dependencies
CreatedBank for slot N+1 cannot occur until slot N is frozen⁸. If an endpoint is slow processing slot N, it delays everything downstream. This cascading effect means consistency matters more than occasional fast slots - one slow slot creates a ripple effect.
Transaction execution ordering
Due to SIMD-0083², transactions within an entry can have account lock conflicts. The replay stage attempts to lock accounts for entire entries, falling back to individual transaction locking when conflicts occur⁹. This means execution patterns can vary slightly between validators while maintaining state consistency through write locks.
Why Agave metrics don’t reflect real latency
Agave provides detailed InfluxDB metrics that precisely track each internal stage. However, when benchmarking RPC endpoints, we only have access to what the gRPC interface exposes¹⁰. We're measuring the entire pipeline, including plugin processing and gRPC serialization—the actual latency users experience, not validator-internal metrics.
Thorofare benchmarking methodology
Data collection and filtering
We establish concurrent gRPC subscriptions to both endpoints and collect all slot and account updates into pre-allocated vectors. We use monotonic clocks (Instant) for duration calculations to avoid clock skew, and wall clocks (SystemTime) for UI timeline visualization.
We collect the target number of slots plus a configurable buffer (typically 10%) to account for filtered slots. At 2.5 slots/second (with slots being 400ms¹¹), 1000 slots represents approximately ~6-7 minutes of real-world behavior.
After the collection completes, we filter for slots where both endpoints received¹²:
- The same number of slot status updates
- The same number of account updates (if tracking accounts)
- All six required status transitions, excluding
Deadslots.
Only then do we calculate comparative metrics to ensure a fair comparison.
Key terms used in Thorofare benchmark
Before we go into the specific steps for using Thorofare to measure in-depth Solana Geyser endpoint performance, you must first understand how we define some terms in this article.
These are by no means standard Solana terminologies, but they will help us communicate specific benchmarks with precision.
|
Our term |
Our definition |
|
Waiting Time |
For matching slots, we compare the times at which each endpoint saw the same status transition. If Endpoint A sees FirstShredReceived at T1 and Endpoint B at T2, the slower endpoint has a waiting time of |T2 – T1|.
Important: |
|
Download Time |
Duration from FirstShredReceived to Completed . Represents how long it takes to receive and assemble all the shreds. |
|
Replay Time |
Duration from CreatedBank to Processed . Represents transaction execution performance. |
By measuring durations between stages on the same endpoint, we isolate computational performance from network effects. For example, Replay time measured on a single endpoint isn't affected by network distance since both timestamps come from the same source.
Account updates as execution speed indicators
We track account updates with composite keys (slot, pubkey, transaction_signature) to match updates between endpoints. Account update delays directly indicate differences in execution speed between endpoints. Since both endpoints run identical subscriptions, consistent delays reveal which endpoint processes transactions faster.
The pattern follows account lock ordering at a minimum, making it a reliable comparative metric. When one endpoint consistently delivers certain account updates 20-30ms faster, that's your actual execution advantage.
How to get started
Prerequisites
First, open your terminal and follow the Thorofare README guide on Github to install Thorofare and its prerequisites on your machine.
After installing Thorofare, it’s time to run the commands in your preferred terminal.
Quick start
thorofare --endpoint1 your-endpoint.com:10000 --endpoint2 comparison.com:10000 --slots 1000
The benchmark will:
- Measure baseline ping latency to both endpoints
- Collect all slot transitions and account updates.
- Output results in JSON format (that you can import to the visualization UI)
Complete documentation and installation instructions are available in the repositories.
How to interpret Thorofare results
The benchmark produces:
- Waiting time distributions showing which endpoint receives data first
- Download and replay time percentiles showing consistency
- Account update delay patterns revealing execution speed differences
- Correlation analysis between slot complexity and processing time
These metrics together provide comprehensive endpoint characterization beyond simple latency measurements.
Insights from benchmarking across RPC providers
After running this benchmark across major RPC providers, patterns emerge:
- Hardware differences show up clearly in replay time variance
- Network optimizations help a lot to receive the shreds
- Receiving the
FirstShredReceiveddoesn’t mean the endpoint will end up winning in account updates - Parent slot processing delays end in a cascade effect
- HTTP/2 Window Size for heavy subscriptions matters a lot
Limitations and measurement caveats
- We measure from the client perspective, not software internals
- Network jitter affects all measurements
- Geographic differences create baseline advantages/disadvantages
- Different subscription loads between endpoints could affect comparisons (i.e., subscribing to all accounts; adding blocks)
- We cannot distinguish some network effects from endpoint processing
Conclusion: full truth about RPC performance
Run this benchmark on your current endpoints, but remember that you need something to compare against. Get a trial endpoint from Triton One or any other provider to see how your current setup actually performs. You might discover significant differences you never knew existed.
The tools are open source. The methodology is transparent.
The only question is: what's your endpoint's real performance compared to alternatives?
Simple processed-to-processed measurements tell simple lies. Comprehensive benchmarking reveals the complex truth about RPC performance - download speeds, execution efficiency, network topology effects, and consistency patterns that determine real-world success.
At Triton One, we use tools like this to continuously study and improve our infrastructure and software, ensuring we provide the fastest and most reliable service for our traders and customers. We've spent years obsessing over these microseconds so you don't have to (and we don't plan to stop here 😉).
References
- Solana Shred Specification
- SIMD-0083: Relax Entry Constraints
- Agave PR #4253: Entry Execution Improvements
- Agave’s Entry Implementation
- Agave’s VersionedTransaction Implementation
- Agave’s FirstShredReceived Implementation
- Agave’s SlotStatus Implementation
- Agave’s Bank Freeze Implementation
- Agave’s queue lock account from transactions
- Agave’s Geyser Plugin Interface
- Agave’s Ticks per slot constant
- Thorofare Slot filtering