
Solana gRPC streaming optimisation and troubleshooting (2026 guide)
TL;DR
- Solana’s average daily TPS has almost doubled since December (832 → 1,570). That means x4 more account changes, and the bandwidth needed to stream them
- If your client can’t keep up with this increased throughput, data accumulates in buffers, causing you to drift away from the tip and get disconnected from the stream
- For latency‑sensitive, high‑volume workloads, following best practices stops being optional
- For full‑chain subscriptions (accounts + transactions), you should plan around a 10 Gbps download capacity from your subscriber host
- Target round-trip time of ≤ 50 ms to your RPC endpoint. The further away you are, the more “perfect” other conditions need to be for your client to keep up with the chain
- Always enable adaptive window sizing. There’s no zero downside to having it on
- If your latency is ≥ 7 ms, enable zstd compression. You add a small CPU delay to save substantial network time by reducing payload size
- Use the Triton Yellowstone test client to check if you’re keeping up with the chain and your observed throughput
- If you prioritise data completeness, persistence, availability and resumability over raw low-latency, use Fumarole instead of Dragon’s Mouth
Introduction
With the new Agave and Firedancer rollouts, Solana is only getting faster. Average TPS has already doubled since December, and a full‑chain feed (transactions + accounts) can now spike up to ~1.3-1.8 Gbps during busy periods. Naturally, more users have started reporting stream disconnects.
After reviewing many cases, we’ve seen that the limiting factor is usually the client‑side setup, and the good news is that most of these bottlenecks are straightforward to fix.
gRPC streaming bottlenecks
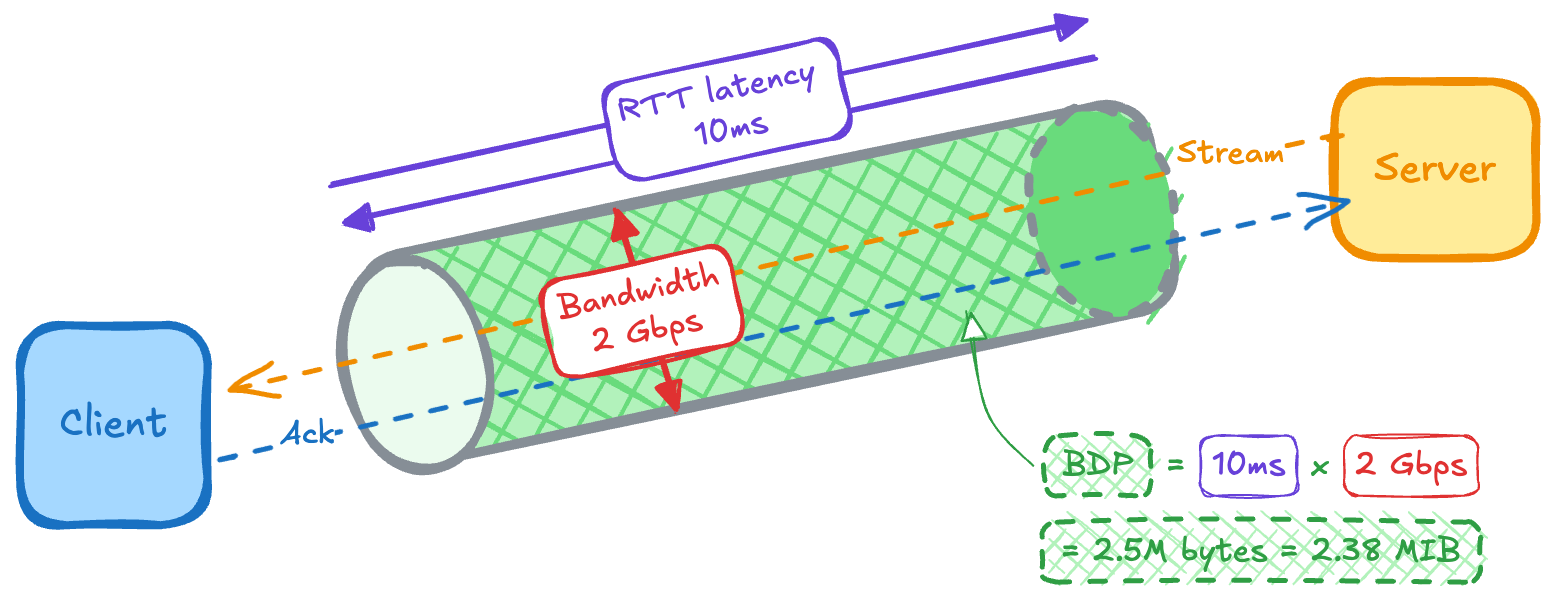
Let’s start by defining the two things your stream (think of it as a pipe) depends on: latency (length of the pipe) and bandwidth (its width).
Latency is the time between sending a request and receiving a response, usually measured as RTT (round‑trip time). It increases with distance: the farther you are from the server, the more propagation delay you add and the higher your floor on latency (bounded by the speed of light in fibre).
Bandwidth is how much data your connection can move per second (sometimes called throughput). In this article, we’ll use a metric called bandwidth delay product (BDP) to describe the “volume” of the pipe: how much data can be in flight at once. BDP is simply bandwidth × RTT. For example, at ~2 Gbps and 10 ms RTT, Solana geyser traffic gives you ~2.38 MiB in flight.
We’ll keep referring to these terms in each bottleneck below.
1. Your flow control window isn’t set to adaptive
gRPC runs on HTTP/2, which uses a flow‑control window to decide how much data can be in flight before acknowledgements arrive. Unlike a “subscribe and forget” UDP feed, where packets are sent without delivery guarantees, HTTP/2 runs over TCP and only allows the server to send data up to the current window size before it must wait for the client to acknowledge what it has received.
The farther you are from our server, the longer the server waits for acknowledgements, and the larger the window needs to be to keep the pipe full. If your window size is too small compared to the BDP (in-flight volume) of your connection, you’re leaving part of your bandwidth idle.
How to fix: your window size needs to be >= BDP. The simplest way to achieve this is to enable adaptive window sizing. This lets the client and server negotiate window sizes dynamically based on current throughput and measured latency. There’s no good reason to disable this, and we strongly recommend keeping it on.
GeyserGrpcBuilder::from_shared(“https://your_endpoint”)
	.http2_adaptive_window_size(true)
2. You haven't considered ZSTD compression
If you’re doing large or full‑chain subscriptions without compression, you’re sending more data over the wire than necessary. That extra volume increases the required BDP, making the stream more sensitive to packet loss and jitter and, over time, more likely to drift, buffer, and disconnect.
How to fix: if your latency is higher than 8 ms (for the full Geyser traffic), and you’re experiencing disconnects, we recommend enabling zstd compression to reduce bandwidth requirements (and window-size). At 30 ms or more, we almost always suggest using it to lower the risk of falling behind the chain.
GeyserGrpcBuilder::from_shared(“https://your_endpoint”)
	.accept_compressed(Some(CompressionEncoding::Zstd))
3. You’re too far away from Triton
One of the biggest drivers of gRPC latency is how far your subscriber is from the endpoint. Distance doesn’t just add the raw speed‑of‑light cost in fibre – as most locations aren’t directly connected, longer routes also need more routers, with each “stop” adding extra delay.
We run nodes in all the main Solana clusters, and you want to be as close as possible to one of those locations. Here are some example distances and the RTT latency they typically translate to:
To see your actual RTT, run ping <endpoint> from your server.
Because of the HTTP/2 framework used in yellowstone-grpc, the maximum supported window size is 14.6MiB. Therefore, the ceiling latency for full‑chain streaming is 14.6 MiB / 2 Gbps (edge‑case Solana throughput) ≈ 60 ms. We recommend targeting below 50ms to give yourself some safety margin.
Regardless of workload, higher RTT always means less tolerance for jitter and variable network quality, so lower is always better.
How to fix: move closer. On major cloud providers, you can easily switch your instance’s location to one of the main Solana data centres. If you cannot easily change location, enabling zstd compression can, in certain circumstances, fix the issue.
4. Your network bandwidth is insufficient
10 Gbps download capacity is strongly recommended for large or full‑chain subscriptions. Different regions have very different connectivity, so it can be harder to reach that speed in parts of Asia or South Africa than in the US.
Also, many cloud instance types cap the network at ~1 Gbps by default, which is only enough for much narrower, focused Solana streams.
How to fix:
- Reduce the amount of data you request. Once you’ve enabled compression and adaptive window sizing, the next lever is scope. Narrow your subscription to include only what you need (for example, specific programs or transactions only), so the required bandwidth fits your current capacity.
- Increase bandwidth. If you really need full‑chain or other large feeds, move your subscriber to an instance type or provider that offers higher download capacity (10 Gbps+).
- Enable Zstd. Enabling compression reduces the bandwidth requirements.
5. You have single‑threaded receive‑and‑process pipeline
A common anti‑pattern in streaming clients is processing data inside the receive loop. If your code receives a transaction, parses it, writes it to a database, and then sends the acknowledgement, all in a single thread, you will almost certainly fill buffers and disconnect under current chain activity.
How to fix: decouple ingestion from processing. Your receive loop should only push messages into a queue/channel and immediately wait for the next one. Use a worker pool to handle parsing, writes, and any other tasks.
How to test your gRPC streaming capacity
We’ve built a tool to check whether your setup can keep up with Solana for a specific subscription, using the exact flags and filters you intend to use in production. It also reports on your actual throughput, so you can confirm whether changes in your code affect how well you track the tip of the chain.
It works by sending a lightweight, application‑level ping message to your subscriber together with the data stream every 10 seconds. The result is:
- Good: if you see the ping number increase by 1 every ~10 seconds, it means you are keeping up perfectly. (You should also see throughput of ~60–80 Mbps for full-chain scans)
- Bad: if you see the new ping every 12+ seconds, or not at all, your client is too slow for the data volume you are requesting, and your setup needs further adjustment
To run the test, download the latest client binary (e.g., client-ubuntu-22.04) and create a subscription with the same settings you plan to use in production. See example code:
./client-ubuntu-22.04 \
  --http2-adaptive-window true \
  --compression zstd \
  --endpoint https://<your-endpoint>.rpcpool.com \
  --x-token <your-token> \
  subscribe \
  --transactions \
  --accounts \
  --stats
When to use Fumarole instead
Dragon's Mouth is designed for traders and bots where ultra-low latency is the metric that matters most. It is a stateless firehose, streaming what the chain is doing right now and does not keep track of where you are, what you missed, or give you an option to restart from disconnection and backfill.
If your workload is:
- Indexing
- Analytics/Accounting
- Compliance
- Archival
- Involves streaming confirmed data only (e.g. wallets)
You should be using Fumarole instead. It’s purpose‑built for these use cases and is the most reliable and complete data‑streaming service on Solana.
It adds a state storage layer between multiple downstream Dragon’s Mouth instances and your client, caching ~23 hours of history and the exact position (cursor) where a disconnect occurred (if it does). By decoupling streaming (Dragon’s Mouth) from storing and from the frontend instances that serve the data, it isolates failures on each side and makes the overall pipeline much more robust.
- Reconnect. If you disconnect, you can resume exactly where you left off using a cursor
- Backfill. You can replay historical data for up to ~23 hours without complex custom logic
- Scale. You can use consumer groups to shard the stream across multiple readers
Troubleshooting checklist
If you’re experiencing issues on Triton endpoints and want our help, don’t hesitate to reach out. Before messaging support, please make sure you have the following information ready (we’ll ask for it):
- What is your download capacity? 10 Gbps is ideal.
- What is your RTT to the endpoint? < 50 ms is ideal.
- Have you enabled HTTP/2 adaptive window and zstd compression? Highly recommended.
- What throughput and ping interval does the test client report?